 blackMORE Ops Learn one trick a day ….
It’s been almost 3 years I’m with Azure and to be honest I never had any issues. However, I found something interesting happening recently. Everytime my server was hit by high traffic volume (either a post went somwhat viral for some unknown reason – I mean come on, my posts are so badly written even I don’t know why anyone but me would read those. .. and also it happens when people uses my own guide to DoS my own server ( ¯\_(ツ)_/¯ ) – yeah, sorry my bad!) Ideally this is not a problem for me because my server is over-spected for to deal with 5k-10k users per day but Azure recently seems to have changed something putting limitations on IOPS and Disk R/W priority. What that means is when I get hit by high trafic volume everything would just slow down. Again, not a big deal but it bothers me when I have something that is out of my control. I like that control over my own server and resources. Almost out of curiosity, I looked around and found UpCloud.com who claims they have the beyond SSD performance and highest IOPS! Now, everytime I’ve seen these I get very skeptical but since signup was free (well sort of, I got a referral code from a friend that adds 25$ credit to the account). I signed up hesitantly and decided to create a server and do some testing and then compare that to Azure Virtual Machine. The results are (very) interesting!
UpCloud VM Config
I went in and deployed a standard VM in UpCloud with following config:
- RAM: 8192 MB
- CPU: 4 CPU
- Disk: 160 GB
- Transfer: 5120 GB
- Network Controller: VirtIO(Default)
- Disk Controller: VirtIO(Default)
- OS: Ubuntu 18.04 LTS
- Firewall: Not Included
Benchmark CPU with Geenbench 3
It’s pretty standard, you either use Geekbench 3 or 4 but since 3 is more widely used, I went for Geekbench 3. Installation is very straight forward in Ubuntu
root@www:~# uname -a
Linux www.blackmoreops.com 4.15.0-32-generic #35-Ubuntu SMP Fri Aug 10 17:58:07 UTC 2018 x86_64 x86_64 x86_64 GNU/Linux

root@www:~#
root@www:~# sudo dpkg --add-architecture i386
root@www:~# sudo apt-get update
root@www:~# sudo apt-get install libc6:i386 libstdc++6:i386 -y
After this simply needed to download Geekbench 3, untar it and run it.
root@www:~# wget http://cdn.primatelabs.com/Geekbench-3.4.1-Linux.tar.gz ~/
--2018-09-19 07:21:07--  http://cdn.primatelabs.com/Geekbench-3.4.1-Linux.tar.gz
Resolving cdn.primatelabs.com (cdn.primatelabs.com)... 52.85.112.102, 52.85.112.71, 52.85.112.143, ...
Connecting to cdn.primatelabs.com (cdn.primatelabs.com)|52.85.112.102|:80... connected.
HTTP request sent, awaiting response... 200 OK
Length: 9990361 (9.5M) [application/x-gzip]
Saving to: 'Geekbench-3.4.1-Linux.tar.gz'

Geekbench-3.4.1-Lin 100%[===================>]   9.53M  28.2MB/s    in 0.3s

2018-09-19 07:21:08 (28.2 MB/s) - 'Geekbench-3.4.1-Linux.tar.gz' saved [9990361/9990361]
FINISHED --2018-09-19 07:21:08--
Total wall clock time: 0.6s
Downloaded: 1 files, 9.5M in 0.3s (28.2 MB/s)
Untarring it:
root@www:~# tar -zxvf ~/Geekbench-3.4.1-Linux.tar.gz && cd ~/dist/Geekbench-3.4.1-Linux/
Running Geekbench 3
root@www:~/dist/Geekbench-3.4.1-Linux# ./geekbench
Geekbench 3 does multiple tests to measure CPU performance, calculates floating point and checks memory speed data. In short, it does things and creates a web report which it uploads to a website. My test results for UpCloud VM is available here:
Uploading results to the Geekbench Browser. This could take a minute or two
depending on the speed of your internet connection.

Upload succeeded. Visit the following link and view your results online:

  http://browser.primatelabs.com/geekbench3/8681159

Visit the following link and add this result to your profile:

  http://browser.primatelabs.com/geekbench3/claim/8681159?key=466728
Benchmark Disk speed with fio
This is where my Azure VM was struggling! It’s important that I fix the disk lag by testing as much I can. fio is a small but fantastic tool to do disk I/O benchmarking and stress test. Installation is very simple:
root@www:~/dist/Geekbench-3.4.1-Linux# sudo apt-get install fio -y
Now lets run some IOPS tests. BTW, IOPS is I/O operations per second. Usually you want to test IOPS thru random read write to disk. With fio and IOPS the higher the IOPS, the faster the storage. For a comparison, a standard 7,200 rpm SATA drive HDD would have a score of 75-100 IOPS.
Random read/write performance
root@www:~/dist/Geekbench-3.4.1-Linux# fio --name=randrw --ioengine=libaio --direct=1 --bs=4k --iodepth=64 --size=4G --rw=randrw --rwmixread=75 --gtod_reduce=1
randrw: (g=0): rw=randrw, bs=(R) 4096B-4096B, (W) 4096B-4096B, (T) 4096B-4096B, ioengine=libaio, iodepth=64
fio-3.1
Starting 1 process
randrw: Laying out IO file (1 file / 4096MiB)
Jobs: 1 (f=1): [m(1)][27.3%][r=283MiB/s,w=95.4MiB/s][r=72.5k,w=24.4k IOPS][eta 0Jobs: 1 (f=1): [m(1)][36.4%][r=270MiB/s,w=90.6MiB/s][r=69.2k,w=23.2k IOPS][eta 0Jobs: 1 (f=1): [m(1)][45.5%][r=274MiB/s,w=91.8MiB/s][r=70.1k,w=23.5k IOPS][eta 0Jobs: 1 (f=1): [m(1)][54.5%][r=271MiB/s,w=91.7MiB/s][r=69.5k,w=23.5k IOPS][eta 0Jobs: 1 (f=1): [m(1)][63.6%][r=258MiB/s,w=85.7MiB/s][r=65.9k,w=21.9k IOPS][eta 0Jobs: 1 (f=1): [m(1)][72.7%][r=282MiB/s,w=94.0MiB/s][r=72.1k,w=24.1k IOPS][eta 0Jobs: 1 (f=1): [m(1)][81.8%][r=281MiB/s,w=95.0MiB/s][r=72.0k,w=24.3k IOPS][eta 0Jobs: 1 (f=1): [m(1)][90.9%][r=284MiB/s,w=94.3MiB/s][r=72.8k,w=24.1k IOPS][eta 0Jobs: 1 (f=1): [m(1)][100.0%][r=284MiB/s,w=93.5MiB/s][r=72.6k,w=23.9k IOPS][eta 00m:00s]
randrw: (groupid=0, jobs=1): err= 0: pid=2973: Wed Sep 19 07:23:34 2018
   read: IOPS=70.7k, BW=276MiB/s (290MB/s)(3070MiB/11111msec)
   bw (  KiB/s): min=261488, max=295496, per=99.92%, avg=282700.18, stdev=8544.88, samples=22
   iops        : min=65372, max=73874, avg=70675.23, stdev=2136.26, samples=22
  write: IOPS=23.6k, BW=92.3MiB/s (96.8MB/s)(1026MiB/11111msec)
   bw (  KiB/s): min=86056, max=98592, per=99.90%, avg=94466.68, stdev=2923.62, samples=22
   iops        : min=21514, max=24648, avg=23616.64, stdev=730.91, samples=22
  cpu          : usr=9.46%, sys=29.91%, ctx=27208, majf=0, minf=8
  IO depths    : 1=0.1%, 2=0.1%, 4=0.1%, 8=0.1%, 16=0.1%, 32=0.1%, >=64=100.0%
     submit    : 0=0.0%, 4=100.0%, 8=0.0%, 16=0.0%, 32=0.0%, 64=0.0%, >=64=0.0%
     complete  : 0=0.0%, 4=100.0%, 8=0.0%, 16=0.0%, 32=0.0%, 64=0.1%, >=64=0.0%
     issued rwt: total=785920,262656,0, short=0,0,0, dropped=0,0,0
     latency   : target=0, window=0, percentile=100.00%, depth=64

Run status group 0 (all jobs):
   READ: bw=276MiB/s (290MB/s), 276MiB/s-276MiB/s (290MB/s-290MB/s), io=3070MiB (3219MB), run=11111-11111msec
  WRITE: bw=92.3MiB/s (96.8MB/s), 92.3MiB/s-92.3MiB/s (96.8MB/s-96.8MB/s), io=1026MiB (1076MB), run=11111-11111msec

Disk stats (read/write):
  vda: ios=781617/261218, merge=0/11, ticks=412260/184136, in_queue=589192, util=98.54%
Summary of Random Read/Write Test
read: IOPS=70.7k, BW=276MiB/s (290MB/s)(3070MiB/11111msec)
write: IOPS=23.6k, BW=92.3MiB/s (96.8MB/s)(1026MiB/11111msec)
READ: bw=276MiB/s (290MB/s), 276MiB/s-276MiB/s (290MB/s-290MB/s), io=3070MiB (3219MB), run=11111-11111msec
WRITE: bw=92.3MiB/s (96.8MB/s), 92.3MiB/s-92.3MiB/s (96.8MB/s-96.8MB/s), io=1026MiB (1076MB), run=11111-11111msec
Random read performance
root@www:~/dist/Geekbench-3.4.1-Linux# fio --name=randread --ioengine=libaio --direct=1 --bs=4k --iodepth=64 --size=4G --rw=randread --gtod_reduce=1
randread: (g=0): rw=randread, bs=(R) 4096B-4096B, (W) 4096B-4096B, (T) 4096B-4096B, ioengine=libaio, iodepth=64
fio-3.1
Starting 1 process
randread: Laying out IO file (1 file / 4096MiB)
Jobs: 1 (f=1): [r(1)][100.0%][r=390MiB/s,w=0KiB/s][r=99.9k,w=0 IOPS][eta 00m:00s]
randread: (groupid=0, jobs=1): err= 0: pid=2979: Wed Sep 19 07:24:05 2018
   read: IOPS=99.3k, BW=388MiB/s (407MB/s)(4096MiB/10558msec)
   bw (  KiB/s): min=384696, max=405384, per=99.85%, avg=396673.14, stdev=4738.98, samples=21
   iops        : min=96174, max=101346, avg=99168.29, stdev=1184.75, samples=21
  cpu          : usr=8.67%, sys=31.31%, ctx=24115, majf=0, minf=71
  IO depths    : 1=0.1%, 2=0.1%, 4=0.1%, 8=0.1%, 16=0.1%, 32=0.1%, >=64=100.0%
     submit    : 0=0.0%, 4=100.0%, 8=0.0%, 16=0.0%, 32=0.0%, 64=0.0%, >=64=0.0%
     complete  : 0=0.0%, 4=100.0%, 8=0.0%, 16=0.0%, 32=0.0%, 64=0.1%, >=64=0.0%
     issued rwt: total=1048576,0,0, short=0,0,0, dropped=0,0,0
     latency   : target=0, window=0, percentile=100.00%, depth=64

Run status group 0 (all jobs):
   READ: bw=388MiB/s (407MB/s), 388MiB/s-388MiB/s (407MB/s-407MB/s), io=4096MiB (4295MB), run=10558-10558msec

Disk stats (read/write):
  vda: ios=1033147/4, merge=0/2, ticks=537228/4, in_queue=529948, util=96.65%
read: IOPS=99.3k, BW=388MiB/s (407MB/s)(4096MiB/10558msec)
READ: bw=388MiB/s (407MB/s), 388MiB/s-388MiB/s (407MB/s-407MB/s), io=4096MiB (4295MB), run=10558-10558msec
Random write performance
root@www:~/dist/Geekbench-3.4.1-Linux# fio --name=randwrite --ioengine=libaio --direct=1 --bs=4k --iodepth=64 --size=4G --rw=randwrite --gtod_reduce=1
randwrite: (g=0): rw=randwrite, bs=(R) 4096B-4096B, (W) 4096B-4096B, (T) 4096B-4096B, ioengine=libaio, iodepth=64
fio-3.1
Starting 1 process
randwrite: Laying out IO file (1 file / 4096MiB)
Jobs: 1 (f=1): [w(1)][93.3%][r=0KiB/s,w=279MiB/s][r=0,w=71.4k IOPS][eta 00m:01s]

randwrite: (groupid=0, jobs=1): err= 0: pid=2983: Wed Sep 19 07:24:28 2018
write: IOPS=70.7k, BW=276MiB/s (289MB/s)(4096MiB/14836msec)
bw ( KiB/s): min=256336, max=312784, per=99.79%, avg=282123.59, stdev=14126.73, samples=29
iops : min=64084, max=78196, avg=70530.90, stdev=3531.68, samples=29
cpu : usr=6.65%, sys=58.88%, ctx=22261, majf=0, minf=8
IO depths : 1=0.1%, 2=0.1%, 4=0.1%, 8=0.1%, 16=0.1%, 32=0.1%, >=64=100.0%
submit : 0=0.0%, 4=100.0%, 8=0.0%, 16=0.0%, 32=0.0%, 64=0.0%, >=64=0.0%
complete : 0=0.0%, 4=100.0%, 8=0.0%, 16=0.0%, 32=0.0%, 64=0.1%, >=64=0.0%
issued rwt: total=0,1048576,0, short=0,0,0, dropped=0,0,0
latency : target=0, window=0, percentile=100.00%, depth=64

Run status group 0 (all jobs):
WRITE: bw=276MiB/s (289MB/s), 276MiB/s-276MiB/s (289MB/s-289MB/s), io=4096MiB (4295MB), run=14836-14836msec

Disk stats (read/write):
vda: ios=0/1041069, merge=0/236522, ticks=0/654296, in_queue=646988, util=97.84%
write: IOPS=70.7k, BW=276MiB/s (289MB/s)(4096MiB/14836msec)
WRITE: bw=276MiB/s (289MB/s), 276MiB/s-276MiB/s (289MB/s-289MB/s), io=4096MiB (4295MB), run=14836-14836msec
I’ve highlighted the read and write IOPS in red in each code section.
Benchmark disk latency with IOPing
Now just because a disk can read write faster doesn’t mean it will down well in real life. There’s latency test that you can do that will tell you what’s the delay between each request. IOPing does just that. It’s a very small tool that runs I/O requests to the disks to benchmark the time to reply. The results display disk latency in the same way ping –test measures network latency. (this is similar to running any command with time in front of them, you get the time output for that command.). Installing is again simple.
root@www:~/dist/Geekbench-3.4.1-Linux# cd
root@www:~# pwd
/root
root@www:~# wget https://launchpad.net/ubuntu/+archive/primary/+files/ioping_0.9-2_amd64.deb
--2018-09-19 07:25:25--  https://launchpad.net/ubuntu/+archive/primary/+files/ioping_0.9-2_amd64.deb
Resolving launchpad.net (launchpad.net)... 91.189.89.223, 91.189.89.222
Connecting to launchpad.net (launchpad.net)|91.189.89.223|:443... connected.
HTTP request sent, awaiting response... 303 See Other
Location: https://launchpadlibrarian.net/238178369/ioping_0.9-2_amd64.deb [following]
--2018-09-19 07:25:25--  https://launchpadlibrarian.net/238178369/ioping_0.9-2_amd64.deb
Resolving launchpadlibrarian.net (launchpadlibrarian.net)... 91.189.89.228, 91.189.89.229
Connecting to launchpadlibrarian.net (launchpadlibrarian.net)|91.189.89.228|:443... connected.
HTTP request sent, awaiting response... 200 OK
Length: 13320 (13K) [application/x-debian-package]
Saving to: 'ioping_0.9-2_amd64.deb'

ioping_0.9-2_amd64. 100%[===================>]  13.01K  --.-KB/s    in 0s

2018-09-19 07:25:25 (170 MB/s) - 'ioping_0.9-2_amd64.deb' saved [13320/13320]
Install it:
root@www:~# dpkg -i ioping_0.9-2_amd64.deb
Selecting previously unselected package ioping.
(Reading database ... 67958 files and directories currently installed.)
Preparing to unpack ioping_0.9-2_amd64.deb ...
Unpacking ioping (0.9-2) ...
Setting up ioping (0.9-2) ...
Processing triggers for man-db (2.8.3-2) ...
Run the test
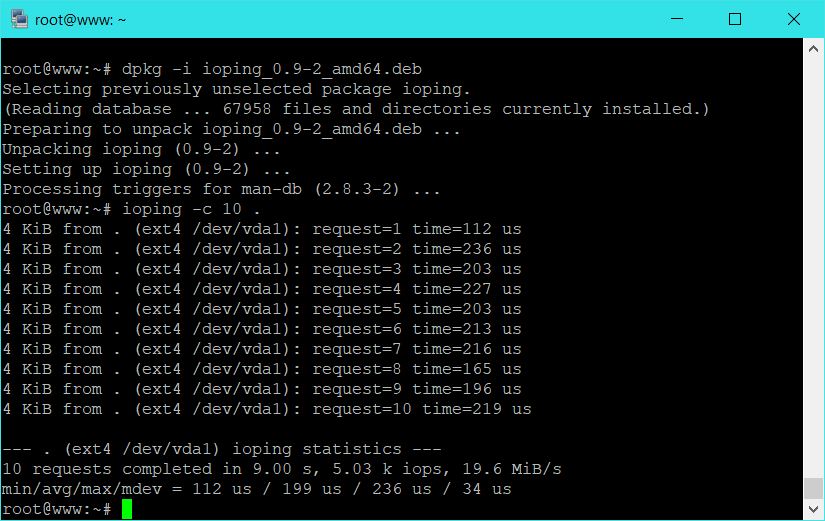
The time above shows the I/O latency measured in microseconds. The lower the delay, the better the performance. So we are looking at an avg of ~199ms I guess!
Azure VM Config
I decided to pretty much clone my VM in Azure to create a new one to run the same tests. Azure doesn’t have the same VM settings, so I had to go bit big on CPU and Memory but I went for Premium SSD option. My Azure VM config: D2s_v3, costs you about $65USD per month.
- RAM: 8192 MB
- CPU: 2 CPU
- Disk: 16 GB
- Transfer: (unlimited?)
- Network Controller: (doesn’t say)Default
- Disk Controller: (doesn’t say)Default
- OS: Ubuntu 18.04 LTS
- Firewall: Included
One thing I always liked about Azure is it’s super stable and I never had any issues other than random slow disk response times. But let’s test away…
Benchmark CPU with Geenbench 3
root@ubuntu18-ws01:~/dist/Geekbench-3.4.1-Linux# ./geekbench
Results here:
Uploading results to the Geekbench Browser. This could take a minute or two
depending on the speed of your internet connection.

Upload succeeded. Visit the following link and view your results online:

  http://browser.primatelabs.com/geekbench3/8681168

Visit the following link and add this result to your profile:

  http://browser.primatelabs.com/geekbench3/claim/8681168?key=542136
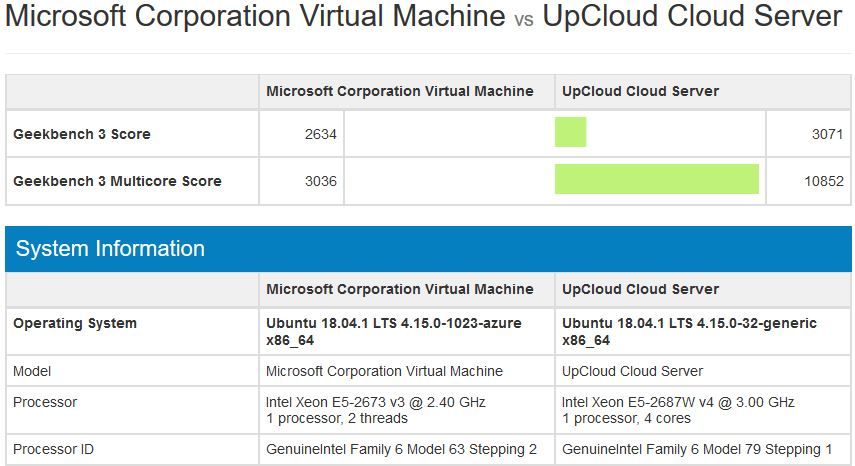
I went in and created a comparison between UpCloud and Azure Geekbench results which can be found here: http://browser.geekbench.com/geekbench3/compare/8681168?baseline=8681159
Well, that’s something I wasn’t expecting, a difference of that much!
Benchmark Disk speed with fio
Random read/write performance
root@ubuntu18-ws01:~/dist/Geekbench-3.4.1-Linux# fio --name=randrw --ioengine=libaio --direct=1 --bs=4k --iodepth=64 --size=4G --rw=randrw --rwmixread=75 --gtod_reduce=1
randrw: (g=0): rw=randrw, bs=(R) 4096B-4096B, (W) 4096B-4096B, (T) 4096B-4096B, ioengine=libaio, iodepth=64
fio-3.1
Starting 1 process
randrw: Laying out IO file (1 file / 4096MiB)
Jobs: 1 (f=1): [m(1)][99.8%][r=11.9MiB/s,w=4116KiB/s][r=3055,w=1029 IOPS][eta 00m:01s]
randrw: (groupid=0, jobs=1): err= 0: pid=2875: Wed Sep 19 08:08:39 2018
   read: IOPS=1409, BW=5640KiB/s (5775kB/s)(3070MiB/557409msec)
   bw (  KiB/s): min=  392, max=13384, per=100.00%, avg=11865.60, stdev=1735.60, samples=529
   iops        : min=   98, max= 3346, avg=2966.38, stdev=433.90, samples=529
  write: IOPS=471, BW=1885KiB/s (1930kB/s)(1026MiB/557409msec)
   bw (  KiB/s): min=    8, max= 4568, per=100.00%, avg=3957.91, stdev=621.97, samples=530
   iops        : min=    2, max= 1142, avg=989.46, stdev=155.49, samples=530
  cpu          : usr=0.50%, sys=1.66%, ctx=101279, majf=0, minf=9
  IO depths    : 1=0.1%, 2=0.1%, 4=0.1%, 8=0.1%, 16=0.1%, 32=0.1%, >=64=100.0%
     submit    : 0=0.0%, 4=100.0%, 8=0.0%, 16=0.0%, 32=0.0%, 64=0.0%, >=64=0.0%
     complete  : 0=0.0%, 4=100.0%, 8=0.0%, 16=0.0%, 32=0.0%, 64=0.1%, >=64=0.0%
     issued rwt: total=785920,262656,0, short=0,0,0, dropped=0,0,0
     latency   : target=0, window=0, percentile=100.00%, depth=64

Run status group 0 (all jobs):
   READ: bw=5640KiB/s (5775kB/s), 5640KiB/s-5640KiB/s (5775kB/s-5775kB/s), io=3070MiB (3219MB), run=557409-557409msec
  WRITE: bw=1885KiB/s (1930kB/s), 1885KiB/s-1885KiB/s (1930kB/s-1930kB/s), io=1026MiB (1076MB), run=557409-557409msec

Disk stats (read/write):
  sda: ios=785945/262856, merge=0/184, ticks=26366708/9518024, in_queue=15619640, util=44.79%
read: IOPS=1409, BW=5640KiB/s (5775kB/s)(3070MiB/557409msec)
write: IOPS=471, BW=1885KiB/s (1930kB/s)(1026MiB/557409msec)
READ: bw=5640KiB/s (5775kB/s), 5640KiB/s-5640KiB/s (5775kB/s-5775kB/s), io=3070MiB (3219MB), run=557409-557409msec
WRITE: bw=1885KiB/s (1930kB/s), 1885KiB/s-1885KiB/s (1930kB/s-1930kB/s), io=1026MiB (1076MB), run=557409-557409msec
Random read performance
root@ubuntu18-ws01:~/dist/Geekbench-3.4.1-Linux# fio --name=randread --ioengine=libaio --direct=1 --bs=4k --iodepth=64 --size=4G --rw=randread --gtod_reduce=1
randread: (g=0): rw=randread, bs=(R) 4096B-4096B, (W) 4096B-4096B, (T) 4096B-4096B, ioengine=libaio, iodepth=64
fio-3.1
Starting 1 process
randread: Laying out IO file (1 file / 4096MiB)
Jobs: 1 (f=1): [r(1)][100.0%][r=15.9MiB/s,w=0KiB/s][r=4080,w=0 IOPS][eta 00m:00s]
randread: (groupid=0, jobs=1): err= 0: pid=3769: Wed Sep 19 08:18:35 2018
   read: IOPS=4077, BW=15.9MiB/s (16.7MB/s)(4096MiB/257192msec)
   bw (  KiB/s): min=14939, max=17952, per=100.00%, avg=16362.75, stdev=155.96, samples=514
   iops        : min= 3734, max= 4488, avg=4090.48, stdev=38.95, samples=514
  cpu          : usr=1.06%, sys=3.55%, ctx=106825, majf=0, minf=72
  IO depths    : 1=0.1%, 2=0.1%, 4=0.1%, 8=0.1%, 16=0.1%, 32=0.1%, >=64=100.0%
     submit    : 0=0.0%, 4=100.0%, 8=0.0%, 16=0.0%, 32=0.0%, 64=0.0%, >=64=0.0%
     complete  : 0=0.0%, 4=100.0%, 8=0.0%, 16=0.0%, 32=0.0%, 64=0.1%, >=64=0.0%
     issued rwt: total=1048576,0,0, short=0,0,0, dropped=0,0,0
     latency   : target=0, window=0, percentile=100.00%, depth=64

Run status group 0 (all jobs):
   READ: bw=15.9MiB/s (16.7MB/s), 15.9MiB/s-15.9MiB/s (16.7MB/s-16.7MB/s), io=4096MiB (4295MB), run=257192-257192msec

Disk stats (read/write):
  sda: ios=1047864/624, merge=0/86, ticks=16321336/8056, in_queue=15811120, util=98.31
read: IOPS=4077, BW=15.9MiB/s (16.7MB/s)(4096MiB/257192msec)
READ: bw=15.9MiB/s (16.7MB/s), 15.9MiB/s-15.9MiB/s (16.7MB/s-16.7MB/s), io=4096MiB (4295MB), run=257192-257192msec
Random write performance
root@ubuntu18-ws01:~/dist/Geekbench-3.4.1-Linux# fio --name=randwrite --ioengine=libaio --direct=1 --bs=4k --iodepth=64 --size=4G --rw=randwrite --gtod_reduce=1
randwrite: (g=0): rw=randwrite, bs=(R) 4096B-4096B, (W) 4096B-4096B, (T) 4096B-4096B, ioengine=libaio, iodepth=64
fio-3.1
Starting 1 process
randwrite: Laying out IO file (1 file / 4096MiB)
Jobs: 1 (f=1): [w(1)][100.0%][r=0KiB/s,w=15.0MiB/s][r=0,w=4084 IOPS][eta 00m:00s]
randwrite: (groupid=0, jobs=1): err= 0: pid=4120: Wed Sep 19 08:42:24 2018
  write: IOPS=764, BW=3059KiB/s (3133kB/s)(4096MiB/1370953msec)
   bw (  KiB/s): min=   24, max=17064, per=100.00%, avg=13249.36, stdev=4911.17, samples=632
   iops        : min=    6, max= 4266, avg=3312.32, stdev=1227.79, samples=632
  cpu          : usr=0.21%, sys=1.42%, ctx=11177, majf=0, minf=6
  IO depths    : 1=0.1%, 2=0.1%, 4=0.1%, 8=0.1%, 16=0.1%, 32=0.1%, >=64=100.0%
     submit    : 0=0.0%, 4=100.0%, 8=0.0%, 16=0.0%, 32=0.0%, 64=0.0%, >=64=0.0%
     complete  : 0=0.0%, 4=100.0%, 8=0.0%, 16=0.0%, 32=0.0%, 64=0.1%, >=64=0.0%
     issued rwt: total=0,1048576,0, short=0,0,0, dropped=0,0,0
     latency   : target=0, window=0, percentile=100.00%, depth=64

Run status group 0 (all jobs):
  WRITE: bw=3059KiB/s (3133kB/s), 3059KiB/s-3059KiB/s (3133kB/s-3133kB/s), io=4096MiB (4295MB), run=1370953-1370953msec

Disk stats (read/write):
  sda: ios=0/1049237, merge=0/26555, ticks=0/170290988, in_queue=15404152, util=18.95%
write: IOPS=764, BW=3059KiB/s (3133kB/s)(4096MiB/1370953msec)
WRITE: bw=3059KiB/s (3133kB/s), 3059KiB/s-3059KiB/s (3133kB/s-3133kB/s), io=4096MiB (4295MB), run=1370953-1370953msec
Benchmark disk latency with IOPing
Run the test
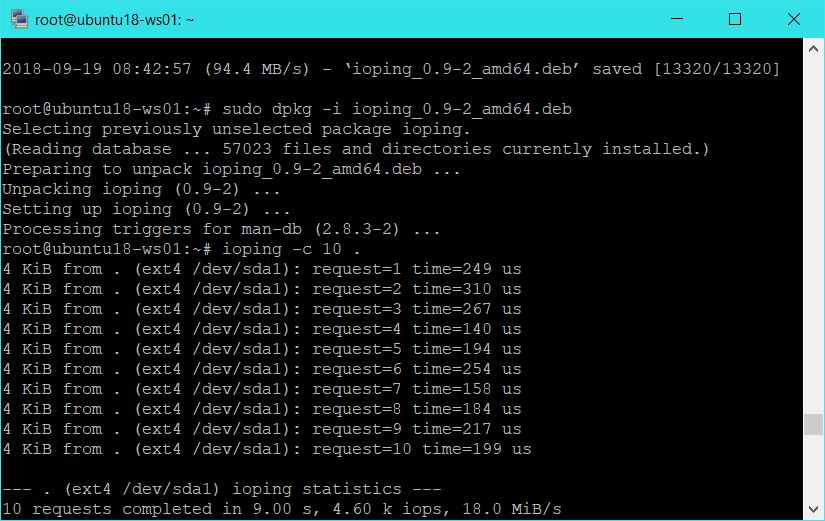
Avg of 217ms!
What is going on?
If you compare the Read/Write values for Azure and UpCloud, it’s just absurd. I could not believe Azure was so slow!
UpCloud:
- READ: bw=276MiB/s (290MB/s), 276MiB/s-276MiB/s (290MB/s-290MB/s), io=3070MiB (3219MB), run=11111-11111msec
- WRITE: bw=92.3MiB/s (96.8MB/s), 92.3MiB/s-92.3MiB/s (96.8MB/s-96.8MB/s), io=1026MiB (1076MB), run=11111-11111msec
Azure:
- READ: bw=5640KiB/s (5775kB/s), 5640KiB/s-5640KiB/s (5775kB/s-5775kB/s), io=3070MiB (3219MB), run=557409-557409msec
- WRITE: bw=1885KiB/s (1930kB/s), 1885KiB/s-1885KiB/s (1930kB/s-1930kB/s), io=1026MiB (1076MB), run=557409-557409msec
I mean serisouly, we are comparing 290MB/s with 5775kB/s READ speed and 96.8MB/s with 1930kB/s write speed. This just cannot be true! I mean if this was true, I honestly don’t know how Azure even works and stays in business. So I went and did some research.
Apparently, Azure or AWS or some big hosts who doesn’t care about small market competition, they limit these type of tests. That might explain why the tests results are just so bad. I thought, well … lets put that to test anyway!How about I download a 4GB ISO file, try to copy or move or delete it on my Azure VM. Surely that is not stress testing, it’s more like normal file-copy operations.
More Azure testing
Decided to download a Debian ISO (4.35GB in size) and time it.
root@ubuntu18-ws01:~# time wget https://cdimage.debian.org/debian-cd/current/amd64/iso-dvd/debian-9.5.0-amd64-DVD-3.iso
--2018-09-19 08:43:58--  https://cdimage.debian.org/debian-cd/current/amd64/iso-dvd/debian-9.5.0-amd64-DVD-3.iso
Resolving cdimage.debian.org (cdimage.debian.org)... 194.71.11.173, 194.71.11.165, 2001:6b0:19::173, ...
Connecting to cdimage.debian.org (cdimage.debian.org)|194.71.11.173|:443... connected.
HTTP request sent, awaiting response... 302 Found
Location: https://gemmei.ftp.acc.umu.se/debian-cd/current/amd64/iso-dvd/debian-9.5.0-amd64-DVD-3.iso [following]
--2018-09-19 08:43:59--  https://gemmei.ftp.acc.umu.se/debian-cd/current/amd64/iso-dvd/debian-9.5.0-amd64-DVD-3.iso
Resolving gemmei.ftp.acc.umu.se (gemmei.ftp.acc.umu.se)... 194.71.11.137, 2001:6b0:19::137
Connecting to gemmei.ftp.acc.umu.se (gemmei.ftp.acc.umu.se)|194.71.11.137|:443... connected.
HTTP request sent, awaiting response... 200 OK
Length: 4674906112 (4.4G) [application/x-iso9660-image]
Saving to: ‘debian-9.5.0-amd64-DVD-3.iso’

debian-9.5.0-amd64-DVD-3.iso                    100%[====================================================================================================>]   4.35G  24.2MB/s    in 3m 16s

2018-09-19 08:47:16 (22.7 MB/s) - ‘debian-9.5.0-amd64-DVD-3.iso’ saved [4674906112/4674906112]


real    3m17.655s
user    0m5.235s
sys     0m10.549s
hmm so it’s 3m17.655s to download a 4.35GB file at 24.2MB/s speed. Bad? No. Could be better though but then again could be limited by Debian server’s rate limiting.
Now, let’s try to make a copy of the file.
root@ubuntu18-ws01:~# time cp debian-9.5.0-amd64-DVD-3.iso debian-9.5.0-amd64-DVD-3-copy.iso

real    2m31.754s
user    0m0.028s
sys     0m4.797s
Seriously, it took 2m31.754s to copy a 4.35GB file!
Try to move that file to /tmp directory?
root@ubuntu18-ws01:~# time mv debian-9.5.0-amd64-DVD-3-copy.iso /tmp

real    0m43.087s
user    0m0.006s
sys     0m0.000s
0m43.087s to delete a file? My VM’s running in my own Desktop in spinny HDD does that faster!
How about delete the file?
root@ubuntu18-ws01:~# time rm /tmp/debian-9.5.0-amd64-DVD-3-copy.iso

real    0m8.040s
user    0m0.000s
sys     0m0.614s
0m8.040s to delete a file!
Summary
I don’t know what’s but Azure’s Premium SSD doesn’t look like it lives up to the standard or promises. Azure might be very stable and large, but there’s things that can be improved. I mean it’s just for Disk, even the CPU benchmark was just all over the place, Azure is nowhere near Upcloud! The only benefit now I can think of is the added Firewall, just Azure costs me around $65 USD per month, UpCloud is $40 USD and maybe added Firewall service. But I run my own Firewalls, so I don’t think that’s a problem for me. I also get 4 CPU and 8GB RAM along with 160GB HDD (not that I need that much) with a savings.
Referral link: https://www.upcloud.com/register/?promo=979U46
Moving to UpCloud.com seems like the right move. I got few websites hosted on Azure, so it will take some time but I am honestly thinking of moving my web server. BTW, I’ve added my promo code that should give you $25 credit! ……
Also, I received multiple messages about my server being slow(mostly from Brazilian Readers, so could be region specific). I could use some favors really; let me know in comments section if my current hosting is fast or not or your general comments regarding it. Comments are as usual anonymous and doesn’t require signup, so feel free. Also, if you are using Upcloud, let me know your experience! I am very keen to move and I will probably write a new article after I’ve moved. Keep in touch!