 blackMORE Ops Learn one trick a day ….
This article describes how to install and use sar (sysstat) a system performance tools for Linux. It comes with plenty of sar examples and usage. Sar is part of the sysstat package. According to the package description it includes the following system performance tools:
- sar: collects and reports system activity information;
- iostat: reports CPU utilization and disk I/O statistics;
- mpstat: reports global and per-processor statistics;
- pidstat: reports statistics for Linux tasks (processes);
- sadf: displays data collected by sar in various formats.
Using sar you can monitor performance of various Linux subsystems (CPU, Memory, I/O..) in real time. You can also collect all performance data on an on-going basis, store them, and do historical analysis to identify bottlenecks. I do not take credits for this post, I have just collected pieces of info from different websites that I found useful and put them together. I thank Ramesh Natarajan from TheGeekStuff.com for publishing his original post back in 2011. I couldn’t have done any better. Credits added as due.
What SAR can do?
In this article I will demonstrate how to install and configure sysstat package (which contains sar utility) and explains how to monitor the following Linux performance statistics using sar.
- Collective CPU usage
- Individual CPU statistics
- Memory used and available
- Swap space used and available
- Overall I/O activities of the system
- Individual device I/O activities
- Context switch statistics
- Run queue and load average data
- Network statistics
- Report sar data from a specific time
The statistics reported by sar deal with I/O transfer rates, paging activity, process-related activities, interrupts, network activity, memory and swap space utilization, CPU utilization, kernel activities and TTY statistics, among others. Both UP and SMP machines are fully supported.
sysstat – SAR examples and usage
This first part describes SAR examples and usage along with installation.
Step 1. Install sysstat Package
sysstat is usually not installed in Linux system by default. You need to install it. You also need to make sure you have the correct repositories added. As I personally use Kali Linux, I’ve added Kali Linux official repositories. Follow your distro documentation to add yours. But it is pretty straight forward.
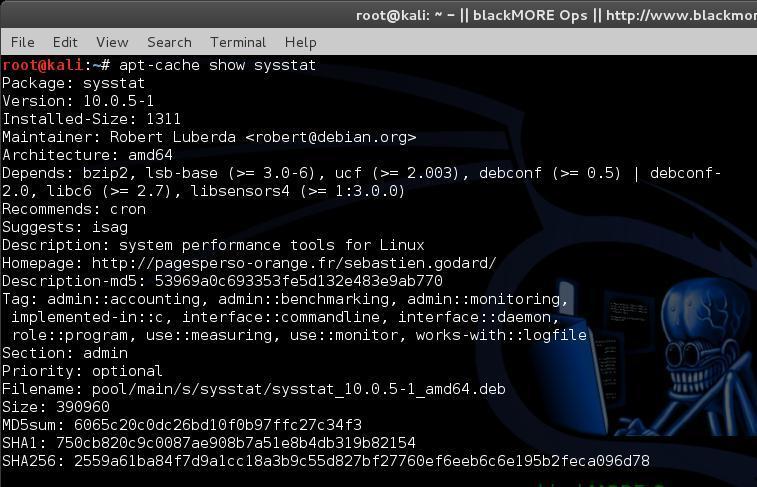
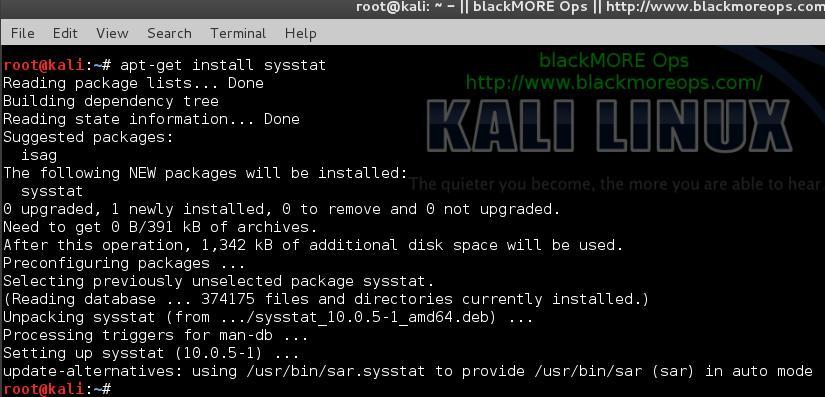
To install sysstat package:
sudo apt-get install sysstat
(or)
yum install sysstat
(or)
rpm -ivh sysstat-10.0.0-1.i586.rpm
Step 2. Enable stat collection
In new systems once you’ve installed sysstat, it enables statistics collections by default. In case it is not you can enable it by editing 1 word in the following file:
vi /etc/default/sysstat
Change ENABLED=”false” to ENABLED=”true”
#
# Default settings for /etc/init.d/sysstat, /etc/cron.d/sysstat
# and /etc/cron.daily/sysstat files
#

# Should sadc collect system activity informations? Valid values
# are "true" and "false". Please do not put other values, they
# will be overwritten by debconf!
ENABLED="true"
Save the file. Restart sysstat.
service sysstat restart
(or)
/etc/init.d/sysstat restart
Once it’s restarted, it will start collecting data.
Step 3. Changing collection intervals
Default sysstat configuration collects data every 10 minutes. You can change it easily. If you got a fast system or you need more intensive monitoring of your system (i.e. a web server with enough RAM and Processor), then you might want to reduce the collection interval from 10 minutes to 2 minutes. Alternatively, you can change it to 15 minutes if you got a slow system. Either way, it’s easy to do and here are the steps:
vi /etc/cron.d/sysstat
# The first element of the path is a directory where the debian-sa1
# script is located
PATH=/usr/lib/sysstat:/usr/sbin:/usr/sbin:/usr/bin:/sbin:/bin

# Activity reports every 10 minutes everyday
5-55/10 * * * * root command -v debian-sa1 > /dev/null && debian-sa1 1 1

# Additional run at 23:59 to rotate the statistics file
59 23 * * * root command -v debian-sa1 > /dev/null && debian-sa1 60 2
Change
5-55/10 * * * * root command -v debian-sa1 > /dev/null && debian-sa1 1 1
To
*/2 * * * * root command -v debian-sa1 > /dev/null && debian-sa1 1 1
Save the file and restart sysstat.
service sysstat restart
(or)
/etc/init.d/sysstat restart
Step 4. Check sysstat version
Once installed, verify the sar version using the following command:
root@kali:~# sar -V
sysstat version 10.0.5
(C) Sebastien Godard (sysstat <at> orange.fr)
Step 5: Practical sar examples and usage
There are two ways to use sar.
- sar followed by an option (without specifying a saXX data file). This will look for the current day’s saXX data file and report the performance data that was recorded until that point for the current day.
- sar followed by an option, and additionally specifying a saXX data file using -f option. This will report the performance data for that particular day. i.e XX is the day of the month.
In all the examples below, we are going to explain how to view certain performance data for the current day. To look for a specific day, add “-f /var/log/sysstat/saXX” at the end of the sar command.
All the sar command will have the following as the 1st line in its output.
root@kali:~# sar -u
Linux 3.14-kali1-amd64 (kali)     17/06/14     _x86_64_    (4 CPU)

21:42:01        all      8.20      0.00      1.21      0.31      0.00     90.28
Average:        all      7.76      0.02      1.97      0.43      0.00     89.82

21:42:26          LINUX RESTART

21:44:01        CPU     %user     %nice   %system   %iowait    %steal     %idle
Average:        all      6.70      0.00      0.63      0.28      0.00     92.38

root@kali:~#
- Linux 3.14-kali1-amd64 – Linux kernel version of the system.
- (kali) – The hostname where the sar data was collected.
- 17/06/14 – The date when the sar data was collected.
- _x86_64_ – The system architecture
- (4 CPU) – Number of CPUs available on this system. On multi core systems, this indicates the total number of cores.
As a last minute check, let’s check some historical Sysstat files.
root@kali:~# ls /var/log/sysstat/
sa03  sa04  sa05  sa17  sa28

root@kali:~# sar -u -f /var/log/sysstat/sa03
Linux 3.14-kali1-amd64 (kali)     03/06/14     _x86_64_    (4 CPU)

18:13:32          LINUX RESTART

18:14:01        CPU     %user     %nice   %system   %iowait    %steal     %idle
18:16:01        all      4.20      0.00      0.82      0.53      0.00     94.45

Average:        all      1.43      0.00      0.36      0.30      0.00     97.90
root@kali:~#
In this way, you can go back since the date you’ve enabled sysstat / sar to check historical data.
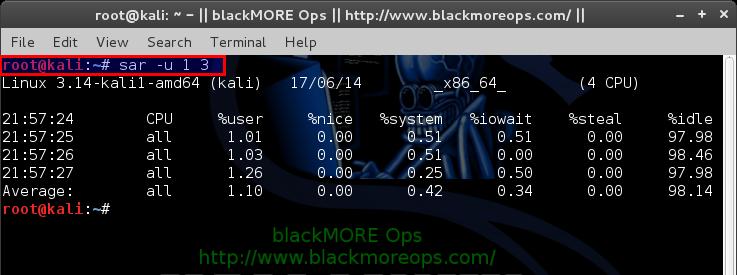
1. CPU Usage of ALL CPUs (sar -u)
This gives the cumulative real-time CPU usage of all CPUs. “1 3″ reports for every 1 seconds a total of 3 times. Most likely you’ll focus on the last field “%idle” to see the cpu load.
root@kali:~# sar -u 1 3
Linux 3.14-kali1-amd64 (kali)     17/06/14     _x86_64_    (4 CPU)

21:57:24        CPU     %user     %nice   %system   %iowait    %steal     %idle
21:57:25        all      1.01      0.00      0.51      0.51      0.00     97.98
21:57:26        all      1.03      0.00      0.51      0.00      0.00     98.46
21:57:27        all      1.26      0.00      0.25      0.50      0.00     97.98
Average:        all      1.10      0.00      0.42      0.34      0.00     98.14
root@kali:~#
Following are few sar examples:
- sar -u Displays CPU usage for the current day that was collected until that point.
- sar -u 1 3 Displays real time CPU usage every 1 second for 3 times.
- sar -u ALL Same as “sar -u” but displays additional fields.
- sar -u ALL 1 3 Same as “sar -u 1 3″ but displays additional fields.
- sar -u -f /var/log/sysstat/sa10 Displays CPU usage for the 10day of the month from the sa10 file.
2. CPU Usage of Individual CPU or Core (sar -P)
If you have 4 Cores on the machine and would like to see what the individual cores are doing, do the following.
“-P ALL” indicates that it should displays statistics for ALL the individual Cores.
In the following sar examples under “CPU” column 0, 1, 2, and 3 indicates the corresponding CPU core numbers.
root@kali:~# sar -P ALL 1 1
Linux 3.14-kali1-amd64 (kali)     17/06/14     _x86_64_    (4 CPU)

22:05:24        CPU     %user     %nice   %system   %iowait    %steal     %idle
22:05:25        all      1.25      0.00      0.50      0.25      0.00     97.99
22:05:25          0      0.00      0.00      0.00      1.00      0.00     99.00
22:05:25          1      3.00      0.00      1.00      0.00      0.00     96.00
22:05:25          2      1.02      0.00      0.00      0.00      0.00     98.98
22:05:25          3      0.00      0.00      0.99      0.00      0.00     99.01
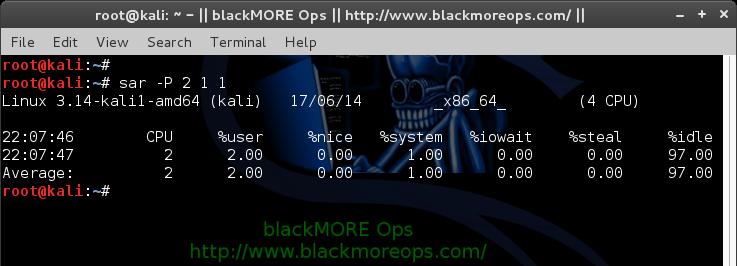
“-P 1″ indicates that it should displays statistics only for the 2nd Core. (Note that Core number starts from 0).
root@kali:~# sar -P 2 1 1
Linux 3.14-kali1-amd64 (kali)     17/06/14     _x86_64_    (4 CPU)

22:07:40        CPU     %user     %nice   %system   %iowait    %steal     %idle
22:07:41          2      1.00      0.00      0.00      0.00      0.00     99.00
Average:          2      1.00      0.00      0.00      0.00      0.00     99.00
root@kali:~#
Following are few sar examples:
- sar -P ALL Displays CPU usage broken down by all cores for the current day.
- sar -P ALL 1 3 Displays real time CPU usage for ALL cores every 1 second for 3 times (broken down by all cores).
- sar -P 1 Displays CPU usage for core number 1 for the current day.
- sar -P 1 1 3 Displays real time CPU usage for core number 1, every 1 second for 3 times.
- sar -P ALL -f /var/log/sysstat/sa10 Displays CPU usage broken down by all cores for the 10day day of the month from sa10 file.
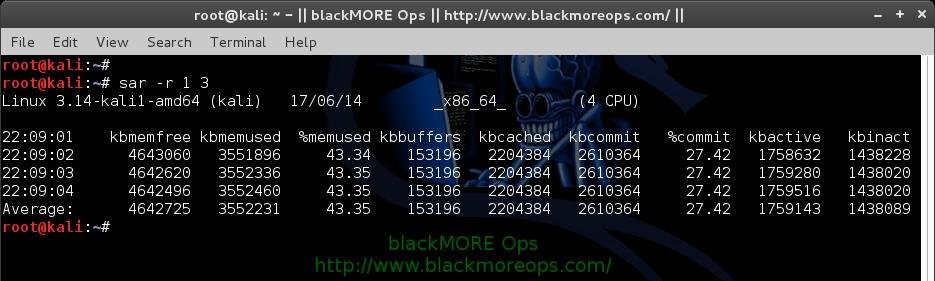
3. Memory Free and Used (sar -r)
This reports the memory statistics. “1 3″ reports for every 1 seconds a total of 3 times. Most likely you’ll focus on “kbmemfree” and “kbmemused” for free and used memory.
root@kali:~# sar -r 1 3
Linux 3.14-kali1-amd64 (kali)     17/06/14     _x86_64_    (4 CPU)

22:08:54    kbmemfree kbmemused  %memused kbbuffers  kbcached  kbcommit   %commit  kbactive   kbinact
22:08:55      4644240   3550716     43.33    153180   2204384   2612376     27.44   1756372   1438360
22:08:56      4644240   3550716     43.33    153180   2204384   2612376     27.44   1756468   1438360
22:08:57      4643744   3551212     43.33    153188   2204384   2612376     27.44   1757084   1438360
Average:      4644075   3550881     43.33    153183   2204384   2612376     27.44   1756641   1438360
root@kali:~#
Following are few sar examples:
- sar -r
- sar -r 1 3
- sar -r -f /var/log/sysstat/sa10
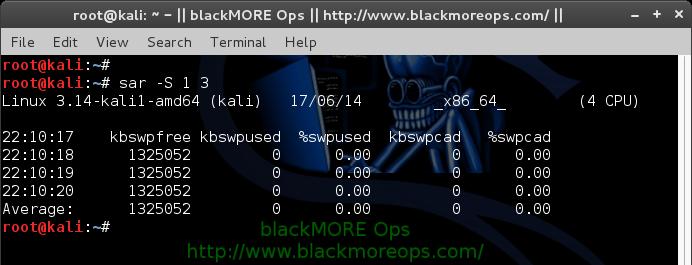
4. Swap Space Used (sar -S)
This reports the swap statistics. “1 3″ reports for every 1 seconds a total of 3 times. If the “kbswpused” and “%swpused” are at 0, then your system is not swapping.
root@kali:~# sar -S 1 3
Linux 3.14-kali1-amd64 (kali)     17/06/14     _x86_64_    (4 CPU)

22:10:03    kbswpfree kbswpused  %swpused  kbswpcad   %swpcad
22:10:04      1325052         0      0.00         0      0.00
22:10:05      1325052         0      0.00         0      0.00
22:10:06      1325052         0      0.00         0      0.00
Average:      1325052         0      0.00         0      0.00
root@kali:~#
Following are few sar examples:
- sar -S
- sar -S 1 3
- sar -S -f /var/log/sysstat/sa10
Notes:
- Use “sar -R” to identify number of memory pages freed, used, and cached per second by the system.
- Use “sar -H” to identify the hugepages (in KB) that are used and available.
- Use “sar -B” to generate paging statistics. i.e Number of KB paged in (and out) from disk per second.
- Use “sar -W” to generate page swap statistics. i.e Page swap in (and out) per second.
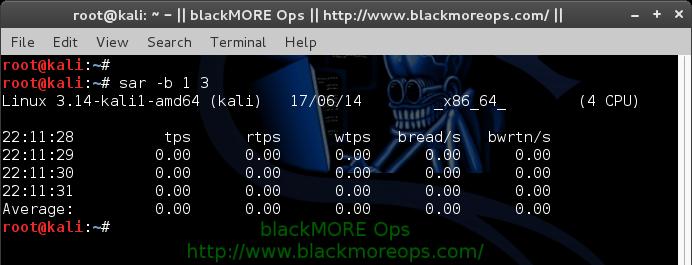
5. Overall I/O Activities (sar -b)
This reports I/O statistics. “1 3″ reports for every 1 seconds a total of 3 times.
Following fields are displays in the example below.
- tps – Transactions per second (this includes both read and write)
- rtps – Read transactions per second
- wtps – Write transactions per second
- bread/s – Bytes read per second
- bwrtn/s – Bytes written per second
root@kali:~# sar -b 1 3
Linux 3.14-kali1-amd64 (kali)     17/06/14     _x86_64_    (4 CPU)

22:11:28          tps      rtps      wtps   bread/s   bwrtn/s
22:11:29         0.00      0.00      0.00      0.00      0.00
22:11:30         0.00      0.00      0.00      0.00      0.00
22:11:31         0.00      0.00      0.00      0.00      0.00
Average:         0.00      0.00      0.00      0.00      0.00
root@kali:~#
Following are few sar examples:
- sar -b
- sar -b 1 3
- sar -b -f /var/log/sysstat/sa10
Note: Use “sar -v” to display number of inode handlers, file handlers, and pseudo-terminals used by the system.
6. Individual Block Device I/O Activities (sar -d)
To identify the activities by the individual block devices (i.e a specific mount point, or LUN, or partition), use “sar -d”
root@kali:~# sar -d 1 1
Linux 3.14-kali1-amd64 (kali)     17/06/14     _x86_64_    (4 CPU)

22:12:08          DEV       tps  rd_sec/s  wr_sec/s  avgrq-sz  avgqu-sz     await     svctm     %util
22:12:09       dev8-0      0.00      0.00      0.00      0.00      0.00      0.00      0.00      0.00
22:12:09      dev8-16      0.00      0.00      0.00      0.00      0.00      0.00      0.00      0.00

Average:          DEV       tps  rd_sec/s  wr_sec/s  avgrq-sz  avgqu-sz     await     svctm     %util
Average:       dev8-0      0.00      0.00      0.00      0.00      0.00      0.00      0.00      0.00
Average:      dev8-16      0.00      0.00      0.00      0.00      0.00      0.00      0.00      0.00
root@kali:~#
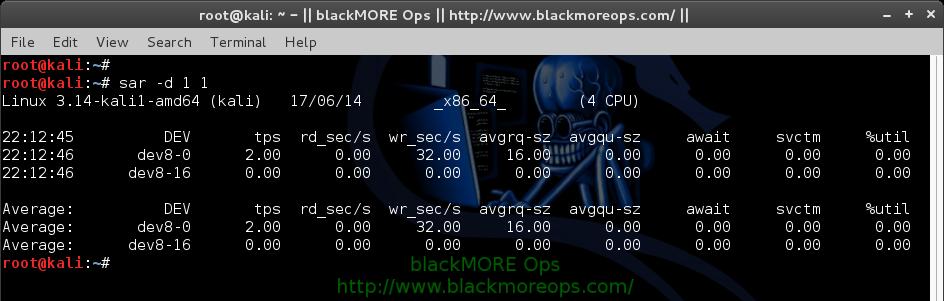
In the above example “DEV” indicates the specific block device.
For example: “dev53-1″ means a block device with 53 as major number, and 1 as minor number.
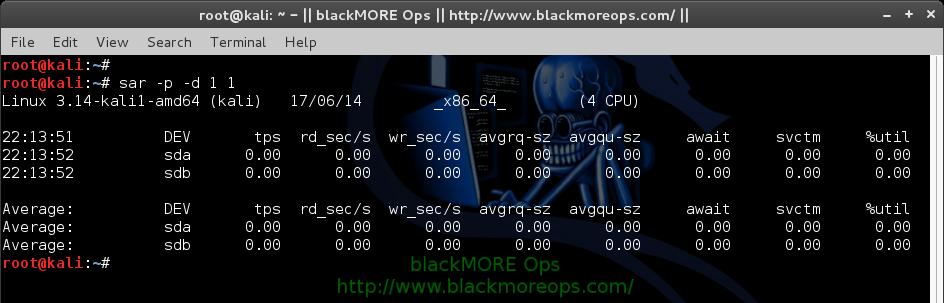
The device name (DEV column) can display the actual device name (for example: sda, sda1, sdb1 etc.,), if you use the -p option (pretty print) as shown below.
root@kali:~# sar -p -d 1 1
Linux 3.14-kali1-amd64 (kali)     17/06/14     _x86_64_    (4 CPU)

22:13:33          DEV       tps  rd_sec/s  wr_sec/s  avgrq-sz  avgqu-sz     await     svctm     %util
22:13:34          sda      0.00      0.00      0.00      0.00      0.00      0.00      0.00      0.00
22:13:34          sdb      0.00      0.00      0.00      0.00      0.00      0.00      0.00      0.00

Average:          DEV       tps  rd_sec/s  wr_sec/s  avgrq-sz  avgqu-sz     await     svctm     %util
Average:          sda      0.00      0.00      0.00      0.00      0.00      0.00      0.00      0.00
Average:          sdb      0.00      0.00      0.00      0.00      0.00      0.00      0.00      0.00
root@kali:~#
Following are few sar examples:
- sar -d
- sar -d 1 3
- sar -d -f /var/log/sysstat/sa10
- sar -p -d
7. Display context switch per second (sar -w)
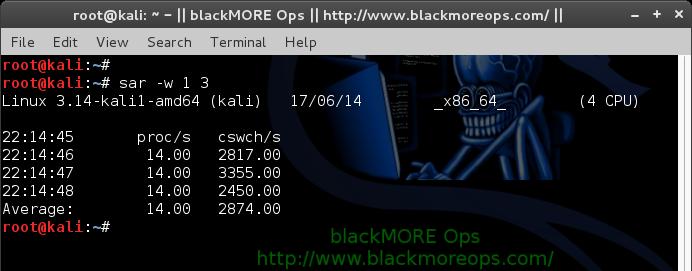
This reports the total number of processes created per second, and total number of context switches per second. “1 3″ reports for every 1 seconds a total of 3 times.
root@kali:~# sar -w 1 3
Linux 3.14-kali1-amd64 (kali)     17/06/14     _x86_64_    (4 CPU)

22:14:45       proc/s   cswch/s
22:14:46        14.00   2817.00
22:14:47        14.00   3355.00
22:14:48        14.00   2450.00
Average:        14.00   2874.00
root@kali:~#
Following are few sar examples:
- sar -w
- sar -w 1 3
- sar -w -f /var/log/sysstat/sa10
8. Reports run queue and load average (sar -q)
This reports the run queue size and load average of last 1 minute, 5 minutes, and 15 minutes. “1 3″ reports for every 1 seconds a total of 3 times.
root@kali:~# sar -q 1 3
Linux 3.14-kali1-amd64 (kali)     17/06/14     _x86_64_    (4 CPU)

22:15:18      runq-sz  plist-sz   ldavg-1   ldavg-5  ldavg-15   blocked
22:15:19            0       392      0.31      0.26      0.29         0
22:15:20            1       392      0.31      0.26      0.29         0
22:15:21            0       392      0.31      0.26      0.29         0
Average:            0       392      0.31      0.26      0.29         0
root@kali:~#
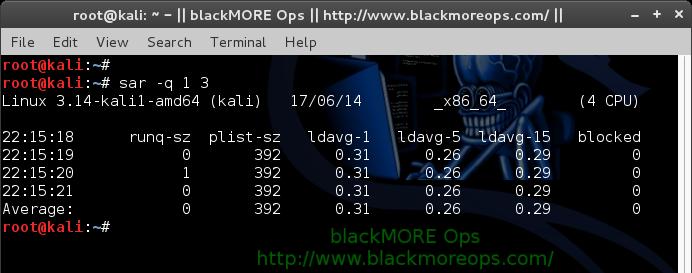
Note: The “blocked” column displays the number of tasks that are currently blocked and waiting for I/O operation to complete.
Following are few sar examples:
- sar -q
- sar -q 1 3
- sar -q -f /var/log/sysstat/sa10
9. Report network statistics (sar -n)
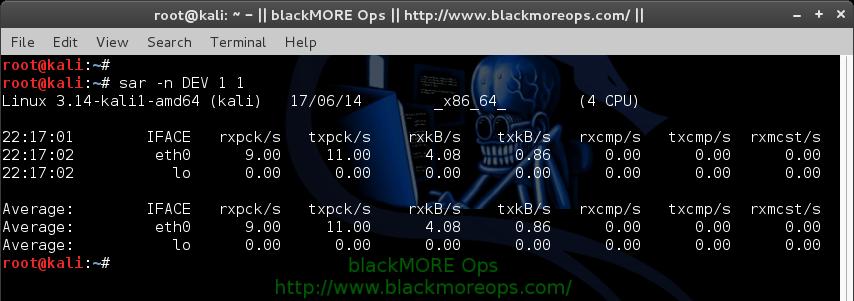
This reports various network statistics. For example: number of packets received (transmitted) through the network card, statistics of packet failure etc.,. “1 3″ reports for every 1 seconds a total of 3 times.
sar -n KEYWORD
KEYWORD can be one of the following:
- DEV – Displays network devices vital statistics for eth0, eth1, etc.,
- EDEV – Display network device failure statistics
- NFS – Displays NFS client activities
- NFSD – Displays NFS server activities
- SOCK – Displays sockets in use for IPv4
- IP – Displays IPv4 network traffic
- EIP – Displays IPv4 network errors
- ICMP – Displays ICMPv4 network traffic
- EICMP – Displays ICMPv4 network errors
- TCP – Displays TCPv4 network traffic
- ETCP – Displays TCPv4 network errors
- UDP – Displays UDPv4 network traffic
- SOCK6, IP6, EIP6, ICMP6, UDP6 are for IPv6
- ALL – This displays all of the above information. The output will be very long.
root@kali:~# sar -n DEV 1 1
Linux 3.14-kali1-amd64 (kali)     17/06/14     _x86_64_    (4 CPU)

22:16:15        IFACE   rxpck/s   txpck/s    rxkB/s    txkB/s   rxcmp/s   txcmp/s  rxmcst/s
22:16:16         eth0      4.00      4.00      0.92      0.26      0.00      0.00      0.00
22:16:16           lo      0.00      0.00      0.00      0.00      0.00      0.00      0.00

Average:        IFACE   rxpck/s   txpck/s    rxkB/s    txkB/s   rxcmp/s   txcmp/s  rxmcst/s
Average:         eth0      4.00      4.00      0.92      0.26      0.00      0.00      0.00
Average:           lo      0.00      0.00      0.00      0.00      0.00      0.00      0.00
root@kali:~#
10. Report Sar Data Using Start Time (sar -s)
When you view historic sar data from the /var/log/sysstat/saXX file using “sar -f” option, it displays all the sar data for that specific day starting from 12:00 a.m for that day.
Using “-s hh:mi:ss” option, you can specify the start time. For example, if you specify “sar -s 10:00:00″, it will display the sar data starting from 10 a.m (instead of starting from midnight) as shown below.
You can combine -s option with other sar option.
For example, to report the load average on 26th of this month starting from 11 p.m in the morning, combine the -q and -s option as shown below.
root@kali:~# sar -q -f /var/log/sysstat/sa17 -s 23:00:01  | head
Linux 3.14-kali1-amd64 (kali)     17/06/14     _x86_64_    (4 CPU)

23:00:01      runq-sz  plist-sz   ldavg-1   ldavg-5  ldavg-15   blocked
23:02:01            2       381      0.19      0.36      0.37         0
23:04:01            0       381      0.19      0.28      0.33         0
23:06:01            0       382      0.07      0.20      0.30         0
23:08:01            1       382      0.17      0.18      0.28         0
23:10:01            1       373      0.06      0.14      0.25         0
23:12:01            0       372      0.10      0.13      0.23         0
23:14:01            0       372      0.36      0.19      0.24         0
root@kali:~#
There is no option to limit the end-time. You just have to get creative and use head command as shown below.
For example, starting from 2300hrs (11PM) if you want to see 7 entries, you have to pipe the above output to “head”
root@kali:~# sar -q -f /var/log/sysstat/sa17 -s 23:00:01  | head
Linux 3.14-kali1-amd64 (kali)     17/06/14     _x86_64_    (4 CPU)

23:00:01      runq-sz  plist-sz   ldavg-1   ldavg-5  ldavg-15   blocked
23:02:01            2       381      0.19      0.36      0.37         0
23:04:01            0       381      0.19      0.28      0.33         0
23:06:01            0       382      0.07      0.20      0.30         0
23:08:01            1       382      0.17      0.18      0.28         0
23:10:01            1       373      0.06      0.14      0.25         0
23:12:01            0       372      0.10      0.13      0.23         0
23:14:01            0       372      0.36      0.19      0.24         0
root@kali:~#

Step 6. If you want to save the statistics for further analysis to a file use:
root@kali:~# sar -A > $(date +`hostname`-%d-%m-%y-%H%M.log)
Conclusion
sysstat or sar is very powerful and useful tool to have. It allows you to monitor your Linux or Solaris systems activity closely and using sar you should be able to identify bottlenecks. Now this is not the end of sar usage and examples. You can use kSar which is the graphical end of sar to view graphs in a proper Graphical interface. kSar allows you to dig down into historical data or even get data from a different workstation to view in a remote machine.
Thanks for reading and don’t forget to share. Stay tuned for kSar guide.
References
- sysstat (sar): http://sebastien.godard.pagesperso-orange.fr/]
- ksar: http://sourceforge.net/projects/ksar/
- TheGeekstuff: TheGeekStuff
- Debian: http://www.debian.org/
- Ubuntu: http://www.ubuntu.com/
- CentOS: http://www.centos.org/
- Gentoo: http://www.gentoo.org/


Nice tutorial as all your tutorials.
Yhat do you think about CONKY ?
Thanks Volkermord.
Conky requires GUI. sar is more in depth and detailed. You can also view historical data in sar whereas conky provides real time data. I was actually writing a guide on conky, will ping you when its done. Cheers,
-BMO
I wrote an extended series of Linux resources monitoring including sysstat (sar, iostat etc). Feel free to take a look: https://www.lisenet.com/tag/sysstat/
Hi Tomas,
That’s excellent. I went through you blog, very concise and to-the-point topics. Thanks for sharing and do keep up the good work. Cheers,
-BMO
Great tutorial! Love it!
After sar report is collected, next step is to visualize the report. For that https://github.com/sumitbiswasgit/sarbox can be used which will help to display numbers into graphs for different categories.