Digital crime has escalated to unprecedented levels, with cybercriminals generating approximately 1.5 trillion dollars annually in illicit profits. As major organisations like GitHub face increasingly sophisticated attacks daily, understanding the global landscape of cyber threats becomes crucial. Live cyber attack maps provide real-time visualisation of digital threats, offering valuable insights into attack patterns, sources, and destinations across the globe.
Cyber attack maps serve as powerful tools for visualising digital threat incidents, helping security professionals, researchers, and organisations understand the ever-evolving landscape of cybercrime. These interactive platforms display real-time data about various types of cyber attacks, including DDoS attacks, malware infections, spam campaigns, and botnet activities occurring worldwide. This is an updated post from my old post as more and more companies are now hosting these maps.
Table of Contents
Understanding DDoS Attacks Through Live Visualisation
A Distributed Denial of Service (DDoS) attack represents one of the most common forms of cybercrime visualised on these digital threat maps. These attacks overwhelm targeted servers by flooding them with traffic from multiple compromised sources, effectively creating a digital traffic jam that prevents legitimate users from accessing services.
DDoS attacks operate through botnets—networks of infected computers controlled remotely by cybercriminals. Once attackers establish control over these compromised machines, they coordinate simultaneous requests against target servers, causing system overloads and service disruptions. Live cyber attack maps excel at displaying these coordinated attacks in real-time, showing the geographical distribution of both attack sources and targets.
The frequency of cyber attacks has increased dramatically, with security professionals noting that hackers launch attacks approximately every 39 seconds. This translates to roughly 2,244 attacks per day globally, making real-time monitoring through live cyber attack maps increasingly valuable for threat intelligence.
Live Cyber Attack Maps for Digital Threat Monitoring
1. Digital Attack Map by Arbor Networks & Google
The Digital Attack Map represents a collaboration between Arbor Networks and Google Ideas, providing comprehensive visualisation of global DDoS attacks. This platform displays live data from over 300 Internet Service Providers worldwide, monitoring more than 130 Tbps of network traffic. Users can explore both real-time and historical attack data, making it an excellent resource for understanding attack trends and patterns.
2. Kaspersky Cyberthreat Live Map
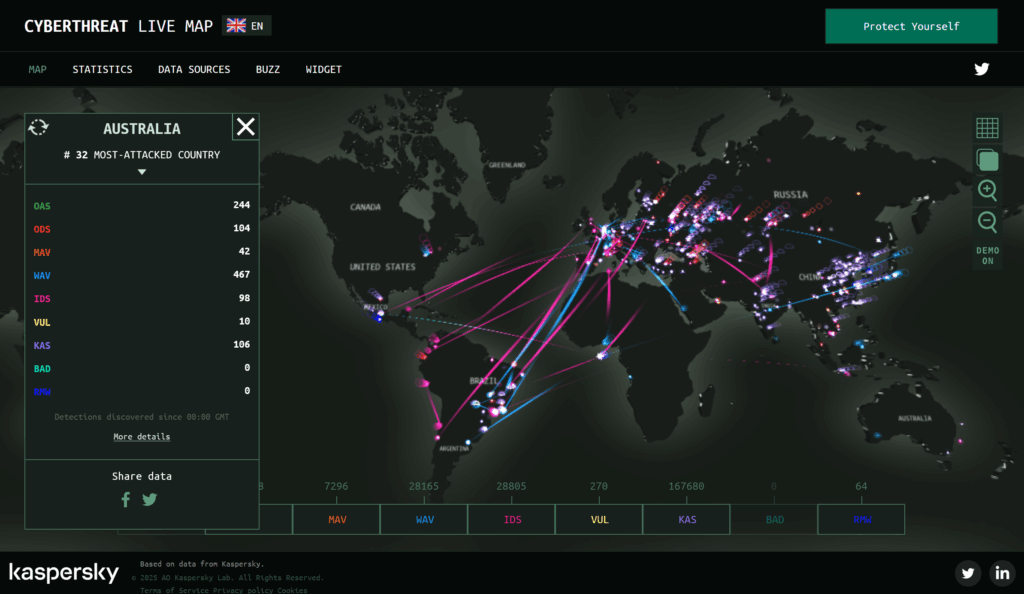
Kaspersky’s cyberthreat map offers one of the most visually impressive and comprehensive live cyber attack maps available. This platform detects users’ locations automatically and displays localised threat statistics, including recent attacks and infections. The map monitors various threat types including malware detection, web-based attacks, email threats, and intrusion attempts, providing a holistic view of the global threat landscape.
3. CheckPoint Live Cyber Threat Map
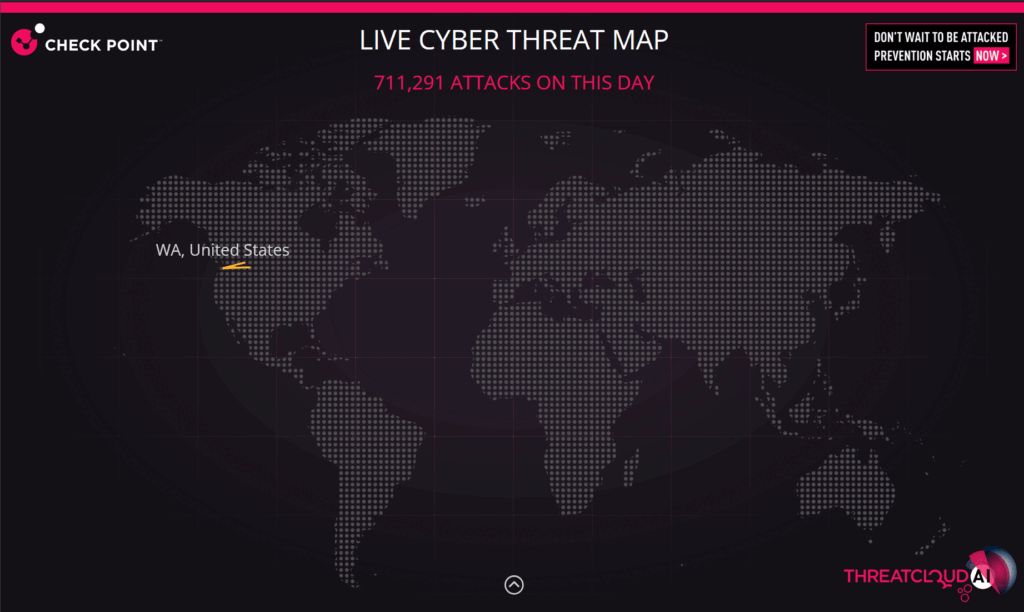
The CheckPoint threat map delivers real-time statistics about cyber attacks worldwide through its ThreatCloud intelligence system. This platform excels at showing live attack data, including attack sources, destinations, and frequency. The map features detailed country-specific statistics and identifies top targets globally, offering valuable insights into regional threat patterns.
4. Fortinet Outbreak Threat Map
Fortinet’s threat map visualises malicious network activity across different geographical regions, displaying various attack types through colour-coded indicators. The platform categorises threats by type, including remote execution attacks, memory-related attacks, denial of service attacks, and generic threats. Users can access detailed statistics for individual countries, viewing both incoming and outgoing attack data.
5. Radware Live Cyber Threat Map
The Radware live threat map provides real-time visualisation of cyber attacks detected by Radware’s global sensor network. This platform focuses on DDoS attacks and other network-layer threats, offering detailed information about attack vectors, sources, and targets. The map displays attack intensity through visual indicators, helping users identify regions experiencing high levels of malicious activity.
6. Threatbutt Internet Hacking Attack Attribution Map
Threatbutt’s attack map features a distinctive retro design with black and green aesthetics, displaying real-time cyber attacks through red connecting lines between source and target countries. This platform provides detailed information about each attack, including origin country, IP addresses, and destinations, often accompanied by humorous commentary that makes cybersecurity data more accessible.
7. Talos Cyber Attack Map
The Talos intelligence map specialises in spam and malware detection, utilising data from Talos sensors and third-party feeds. This platform identifies the world’s top spam and malware sources, providing detailed information about malicious senders including IP addresses, hostnames, and reputation status. The map offers valuable insights into email-based threats and malware distribution networks.
8. Spamhaus Live Botnet Threats Map
Spamhaus threat map focuses specifically on botnet activities and command-and-control infrastructures. This platform identifies areas with high botnet activity and potential control servers, using visual indicators to show activity intensity. The map provides crucial intelligence about botnet operations, helping security professionals understand the infrastructure behind coordinated cyber attacks.
9. Bitdefender Live Cyber Threat Map
The Bitdefender threat map offers an interactive visualisation of global infections, attacks, and spam activities. This Romanian-based security company’s platform provides real-time attack reports, including timestamps, attack types, source locations, and target countries. The map excels at displaying various threat categories simultaneously, offering a comprehensive view of the current threat landscape.
10. SonicWall Live Cyber Attacks Map
SonicWall’s attack map provides detailed visualisation of worldwide attacks over the past 24 hours. This platform displays various threat types including malware, ransomware, encrypted threats, intrusion attempts, and phishing attacks. The map includes comprehensive attack statistics and security research from SonicWall’s Capture Labs team.
Interpreting Cyber Attack Map Data
Understanding live cyber attack maps requires recognising their limitations and capabilities. Most platforms display historical data rather than truly real-time information, typically updating hourly or with slight delays. Additionally, the geographical locations shown often represent compromised systems rather than actual attacker locations, as cybercriminals frequently use infected computers as proxies.
The value of cyber attack maps lies in their ability to reveal attack patterns, identify emerging threats, and provide situational awareness about global cybersecurity trends. Security professionals use these tools for threat intelligence, helping organisations understand their risk exposure and implement appropriate defensive measures.
Protection Strategies Against Cyber Threats
Organisations can leverage insights from live cyber attack maps to enhance their security posture. Large enterprises and Internet Service Providers should implement comprehensive DDoS mitigation services, often provided by companies like Arbor Networks and other cybersecurity specialists. These services combine real-time monitoring with automated response capabilities to minimise attack impact.
Individual websites can protect themselves by working with hosting providers that offer DDoS protection services. Implementing content delivery networks and distributed caching helps filter malicious traffic while reducing server strain. Many security companies now offer cloud-based protection services specifically designed to mitigate cyber attacks before they reach target infrastructure.
Future of Digital Threat Visualisation
Live cyber attack maps continue evolving to address the increasing sophistication of cyber threats. These platforms are incorporating artificial intelligence and machine learning capabilities to provide better threat prediction and analysis. As cybercriminals develop new attack vectors, these visualisation tools adapt to track emerging threats and provide actionable intelligence for security professionals.
The integration of threat intelligence feeds from multiple sources enhances the accuracy and comprehensiveness of cyber attack maps. This collaborative approach helps create a more complete picture of the global threat landscape, enabling better-informed security decisions across organisations worldwide.
Digital threat visualisation through live cyber attack maps represents an essential component of modern cybersecurity strategy. These tools provide invaluable insights into the constantly evolving world of cyber threats, helping organisations and security professionals stay ahead of malicious actors. As cyber attacks continue increasing in frequency and sophistication, the importance of real-time threat monitoring through these platforms will only grow.
Understanding and utilising live cyber attack maps enables better threat awareness, improved incident response, and more effective security planning. Whether used for research, threat intelligence, or educational purposes, these platforms offer unique insights into the digital battlefield where cybersecurity professionals work to protect our increasingly connected world.


